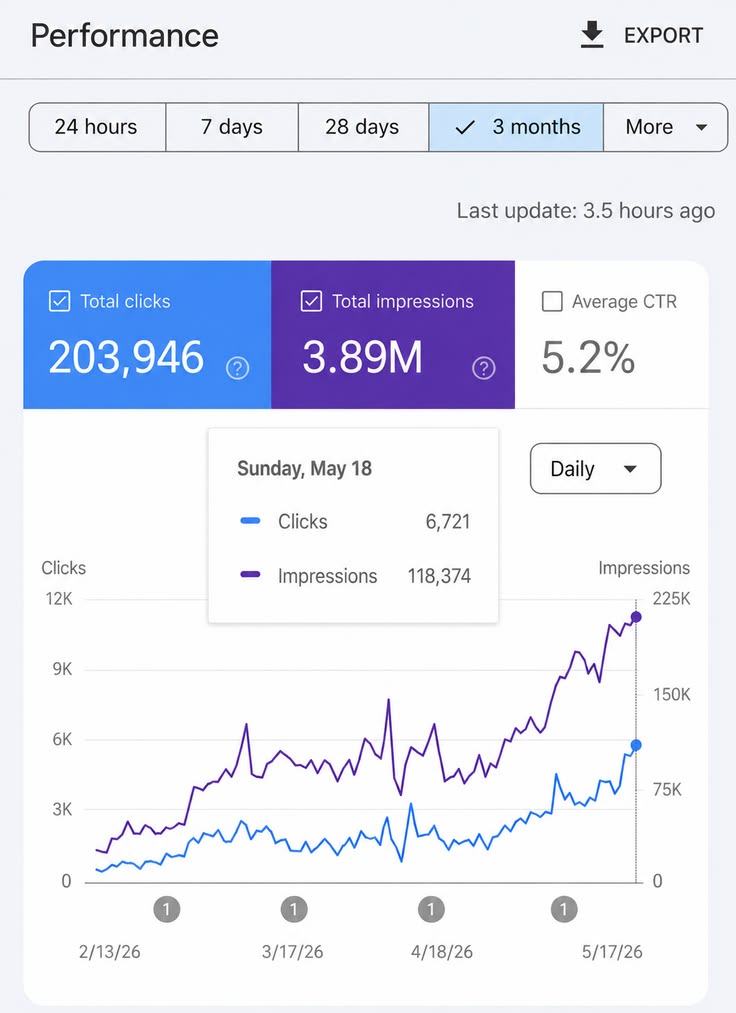
Every advertiser has stared at a report and asked the same quiet question: is this number good or bad? You spent the money, the clicks came in, and a handful of conversions landed. Five last week, two this week. Should you panic, celebrate, or do nothing at all?
Most of us answer that question with a gut feeling, and the gut is a terrible statistician. It treats every dip as a crisis and every spike as a breakthrough, when most of the movement is just noise. The good news is that there is a clean way to tell signal from noise, and it does not require a math degree. It borrows one idea from something called the binomial distribution and turns it into a formula you can run in your head.
Here is the idea. Every click is a coin flip. Most flips do not convert, but each one carries a small chance of converting, and that chance is your normal conversion rate. If you flip the coin enough times, you can predict roughly how many conversions you should see. You can also predict how much that number will naturally bounce around from week to week, even when nothing is wrong. That bounce is the part people forget, and it is the part that saves you from chasing ghosts.
To run the check, you need three numbers you already have. Your clicks for the period. Your baseline conversion rate, pulled from a long stretch of history rather than the week you are judging. And your actual conversions for the period.
Using Binomial Distribution to Identify Normal or Outlier Conversion Data in Marketing
To analyze whether the number of daily conversions from a marketing campaign is normal or an outlier using the binomial distribution, you treat each visitor or impression as a trial with two possible outcomes: conversion (success) or no conversion (failure).
- Number of trials (Clicks): This is the total number of potential conversion opportunities in one day, e.g., total visitors, clicks, or impressions on that day.
- Observed number of successes (conversions): This is the actual number of conversions recorded on that day.
- Probability of success (conversion rate): This is the known or estimated conversion rate (e.g., if historically 5% convert, then $p=0.05).
Here’s what the formula looks like.
This formula may look complicated, but in practice it’s pretty straightforward…so I’m going to simply this formula into something we can use specifically for paid media so that it looks something like this:
Here’s a breakdown of what each of these variables represents. You supply three inputs: clicks (c), your conversion rate as a decimal (r), and your actual conversions (a). Everything else is built from these variables.
- c – clicks
- r – conversion rate (as a decimal)
- a – actual conversions
- e – expected conversions
- d – standard deviation
- s – score
To make this as comprehensible as possible, I’m going to break each portion of the formula so that we can step by step to make sure you understand how each component fits within the whole.
e = Expected value
This is the number of conversions the curve predicts on average. It is the middle of everything. Clicks times conversion rate. In layman’s terms, this is the number of conversions we expect over a given amount of time, taking into account the number of clicks received and the conversion rate.

d = Standard deviation
Standard deviation is one of my favorite mathematical concepts. It measures how far the numbers in a set typically sit from the mean of that set.

m = Margin
Multiplying 2 times the standard deviation gives you the basis for a range of what is a normal amount of conversions. About 95 percent of all binomial outcomes fall within that range of the center, which is where the 2 comes from. It is not arbitrary.
The range and the score measure the same band in two different units. The range counts in conversions. The score counts in steps out from the center. Line them up and every score points to a matching conversion count. The edges match because 2 steps out from the center is both a score of 2 and the edge of the range.
Conversions 0 2 4 6 8 Score −2 −1 0 +1 +2 Your 2 conversions sit at a score of −1 on the bottom row and inside 0 to 8 on the top row. Same spot, two labels.
To turn a score back into conversions, multiply the score by one step, then add the center. Score times standard deviation, plus expected value.

s = Score
One number that says how far your actual conversions sit from the center, counted in standard deviations. A shortcut for the same verdict the range gives. Reading the score is the easy part. Anywhere from two below zero to two above zero is normal, and you should leave it alone. More than two below zero means the number is genuinely low and worth investigating. More than two above zero means something is working, or your tracking changed, and you should confirm the count is real.

How the normal range is built
This is the part that trips people up, so here it is slowly. The expected value is where you stand. The margin is how far you are allowed to walk in either direction before the number stops being ordinary. Walk the margin down for the low edge, up for the high edge.
Read it as expected value give or take the margin. The standard deviation is not the range. It is the size of one step. The expected value is the anchor you step out from.
Working Example
An account drove 600 clicks, your conversion rate over the last 90 days is 0.67 percent (0.0067), and you booked 2 conversions. Watch the range come together one rung at a time.
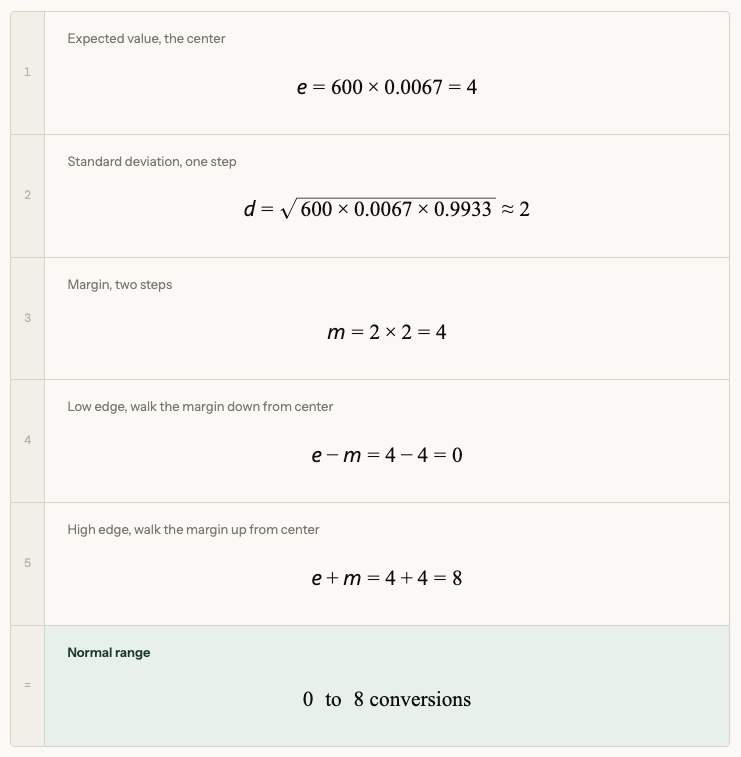
Your 2 conversions sit inside that range, so there is nothing to act on. The score says the same thing in one number:

One standard deviation below center. Comfortably inside the margin.
Score and range, same band
The range and the score measure the same band in two different units. The range counts in conversions. The score counts in steps out from the center. Line them up and every score points to a matching conversion count. The edges match because 2 steps out from the center is both a score of 2 and the edge of the range.

Your 2 conversions sit at a score of −1 on the bottom row and inside 0 to 8 on the top row. Same spot, two labels.
To turn a score back into conversions, multiply the score by one step, then add the center. Score times standard deviation, plus expected value.

A score of −1, with a center of 4 and a step of 2, gives 4 + (−1 × 2) = 2 conversions. A score of +2 gives 4 + (2 × 2) = 8, the top edge. That is how the two rows above line up.
To Summarize:
If you only keep one formula, keep the score with everything substituted in. Inside the margin means normal.

Reading The Results:
- −2 to +2: Normal – Inside the margin. Random variation. Leave it alone.
- below −2: Too low – Below the range. Check tracking, landing page, targeting.
- above +2: Too high – Above the range. Something is working, or confirm the count is real.
One Limit To Respect:
When conversions are small, single digits over a week, the margin is wide next to the numbers themselves. In the example, the range ran from 0 to 8, which is the math admitting a single week cannot prove much. The fix is more data, not a better formula. Widen the window so clicks and conversions accumulate, and trust the verdict once the expected value clears about 5. Below that, treat the score as a hint, not a ruling.
You do not need to love math to use this. You need three numbers, three steps, and the discipline to wait for the score to clear two before you act. Most of marketing is learning to ignore the noise so you can hear the signal. This is one of the few times the noise can be measured, named, and set aside.
Knowing how the Google Ads auction works is one thing. Spotting where your own account is wasting money is another.
That’s why I put together this Free Google Ads Audit Checklist. It’s the same process I use to review six-figure accounts: 15 checks, ranked by priority and graded so you can quickly see what needs attention.
The first check compares two numbers from different reports. On one national retail account, it uncovered 96,000 clicks that had been paid for but never delivered a sale. That’s A LOT of waste. The same thing could be happening in your account.
Open your account in another tab and give it an hour. You might be surprised by what you find.